
Boost Revenue with These Exclusive Break-Even Tips24 min read
In this post, we’re going to take a deep dive into break-even analysis. You’ll learn how to calculate your break-even point for any given period, and you’ll learn some advanced statistical tools that can help you right the ship should revenue take a dip. By knowing your break-even point—and being able to track it—you’ll know when things aren’t quite right, and you’ll have a better idea of how to right the ship.
Along the way, you’ll learn a few powerful tips for reducing restaurant costs and improving revenue in 2019. After all, cost and revenue are important variables in the break-even formula.
Let’s get started.
What is Break-Even Analysis?
Break-even analysis is an indispensable tool for any business owner. In this section, you’ll learn why you need to know how to perform this calculation and how often you should do so. You’ll also learn about the first variables in the break-even formula: costs.
Let’s dive in.
Why Does It Matter?
Of all the calculations you’ll need to perform in order to gauge the health of your restaurant, including food cost percentage, cost of goods sold and overhead rate, break-even point analysis is by far the most important. In fact, break-even point analysis is the bedrock of any profitable restaurant. It’s not hyperbole to say that this analysis is the foundation of everything else.
The good news is that conducting break-even point analysis is probably a lot easier than you think. You don’t have to brush off your college algebra textbook to get started. Really, you only need to know one equation. Once you know how to perform the basic analysis, then you can move on to more advanced techniques if you choose to.
Many successful restaurant owners rely on the formula we’ll reveal in this post, and they do just fine.
Since looking at a bunch of equations won’t help you if you’re just starting out, we’re going to take a nice, simple, laid back approach in this post. So if you’re allergic to math, this is the post for you.
Let’s start by answering that fundamental question: why is break-even analysis so important?
Well, it’s important because it’s hard to settle on a price for your menu items if you don’t do this analysis first. Restaurant owners who fail to do this analysis are likely to set more arbitrary prices. They’re more likely, for instance, to care about what their competitors are charging. But that is a slapdash approach to pricing that will get you in trouble.
For one thing, your competitors have different costs than you do—more on costs later. Let’s say your closest competitor has a sweet deal with a supplier, effectively locking you out. If they’re able to lower their prices because of that exclusivity deal, then you will need to figure out where you can be competitive. That starts with a break-even analysis. Arbitrarily lowering your price to match theirs is not the answer.
So What is It?
A break-even analysis allows you to determine how many tables you need to clear or the number of dishes you need to sell before you start earning profit. Therefore, it focuses your pricing strategy.
Before you can decide on a fair price for your menu items, you must know what producing those dishes is costing you. You’ll need this crucial information regardless of which pricing methodology you decide to use.
It’s a crucial number, and it can mean the difference between the success and failure of your restaurant. To ‘break even’ means that your revenue equals your costs. It’s not a great place to be, and no business can survive very long at break even, but identifying that point is nevertheless essential.
Later on in this post, after you’ve used the formula to determine your own break-even point, we’ll share some powerful tips for maximizing profit.
How Often?
Any time you add a new menu item, you should conduct a new break-even analysis a few months later. This gives you one way to gauge how the new item is performing, and you can never have too many of those.
Or, if you experience fluctuation in costs, you should conduct a break-even analysis to ensure that your current pricing structure is adequate. Of course, you should conduct this analysis any time you want to forecast profit or create any other financial projections.
In a similar vein, you should keep a record of these calculations over time. A spreadsheet, of the type that Google Sheets or Microsoft Excel provide, works great for this. Both applications allow you to place notes in a given cell. That way, you’ll always know why you performed a new analysis.
Note that if you’re a startup and are conducting this analysis for the benefit of a potential lender, you should place the results in your business plan, in the financial report section.
As you’ll see when we reveal the simple, dead easy break-even analysis formula, the key variable is the element that every business owner hates: costs. In the next section, we’ll tackle these. Costs are an aspect of break-even analysis that many restaurant owners get hung up on. Which costs do you care about? Which can you drop? You’re about to find out.
The Key Element: Costs
There are three types of costs we’re concerned with:
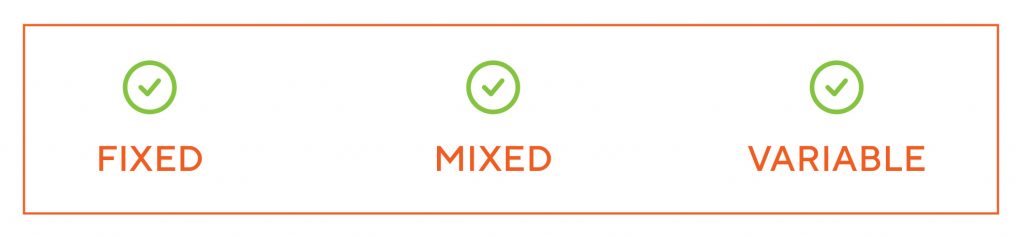
Let’s take a look.
Fixed Costs
Fixed costs, as you might guess, are expenses that don’t vary from month to month. They’re also known as overhead. These costs don’t vary according to sales volume, either. So, if you own a taco truck, your fixed costs won’t vary by the number of tacos you sell each day. Examples include:
- Rent
- Storage space fees
- Lease payment
- Licenses and permits
- Insurance
- Communication tools that come with a fixed monthly bill, such as Internet, phone etc.
Another way to think of fixed costs is that they will be the same each month, whether you serve 1 or 10,000 customers.
In general, fixed costs will not change significantly from one accounting period to another.
Mixed Costs
Mixed costs are somewhere between fixed costs and variable costs. Mixed costs can be influenced to some degree by sales volume.

For instance, you can consider power and water to be mixed costs. They vary from month to month, but not to a significant degree—usually. Yet if you were to stay open until 12pm instead of 11pm, both bills would probably go up a bit.
Your water bill is a mixed cost because it has both a fixed cost component and a variable cost component. The variable element is the actual amount of water you use in a given month. The fixed element is the cost per gallon set by the water company. But this fixed element is actually spread out over the volume of water you consume.
Electricity is similar. Before you can start serving patrons, your staff has to go into the walk-in for raw food. That walk-in is running 24/7. But when you want to feed customers, you have to turn on more lights, heat up the grill and cook. The first aspect of the power consumption, the walk-in, is more or less a fixed cost. But to actually sell your product, you must incur a greater cost, i.e., the cost of cooking food. Well, the cost of cooking food—the cost of running your grill, turning on lights, etc.—varies with sales volume.
It’s possible for rent to be a mixed cost too. For instance, in a standard mall lease, you’ll pay a fixed rent amount, and then you’ll pay a variable amount per month based on sales charge. In other words, the actual rent you pay can vary several hundred dollars per month based on how much business you do.
For our purposes, what’s important to understand is that you should lump mixed costs in with fixed costs when using the formula below.
Break-even analysis would be far too cumbersome and complex if we tried to account for all of these down to the last decimal. Therefore, if you have a mixed cost that does not vary much from month to month, consider it a fixed cost. One way to determine variance is to look at six months of a particular cost and then average it. You can use a spreadsheet software like Google Sheets or Excel to create a chart. If the deviation from average is not significant, then consider it a fixed cost and move on.
Variable Costs
Variable costs, also known as prime costs, vary from month to month, and they vary depending on sales volume, too. Examples include:
- Labor
- Food costs
- Cleaning supplies
- Disposables
- Credit card processing fees
- Payroll taxes
- Benefits
- Training costs
- Maintenance
Note how the entries in the list above are all functions of volume. Your maintenance cost will vary from month to month because your total number of patrons will fluctuate. Thus, you may have higher maintenance costs in the summer and lower maintenance costs in the winter. Similarly, if you operate in a tourist destination like Cancun, the Adirondack Mountain region or Alberta, Canada, your maintenance costs will be lower in the off season.
Variable costs should always have a high correlation to sales volume. If you have a variable cost that does not correlate to sales volume, you may have a gremlin in the machinery.
Some Costs Don’t Matter Here
Fixed, mixed and variable costs are essential for conducting a break-even analysis. But, as mentioned, there are other costs of doing business. But these other costs are irrelevant to break-even analysis. We’re going to briefly touch on them anyway, so you’ll have a firm understanding of what they are and how you might want to use them in other ways.
Sunk Costs
Sometimes, new restaurant owners include sunk costs in break-even analysis, even though there is no reason to do so. They tend to lump them in with fixed costs. Don’t do this.
A sunk cost is any expense you took on before you opened your restaurant. Examples include:
- Remodeling an existing structure
- Restaurant equipment, such as ovens and grills
- Walk-in freezer installation
These costs are sunk, or gone. They do not factor into current break-even analysis. But tallying your sunk costs can be useful if you want to know how much money you need to make to recoup your initial investment. However, you should not use sunk costs to determine whether or not you should continue investing in your business, because those costs are gone. You cannot recover them.
Intangible Costs
Similar to sunk costs, intangible costs cannot be recovered. But they’re not physical, either. Examples include:

Keeping tabs on intangible costs is essential if you want to run a successful restaurant since margins in the industry are so small. Granted, you might not file a patent for a new type of taco every day, but you’ll still want to be able to account for these costs when they do occur. A more common type of intangible you’ll run into at some point is the dreaded attorney fee. These are similar to sunk costs in that you can’t get them back.
Getting back to the essentials—fixed, mixed and variable—you’ll need to have a good idea of what these costs are in your operation. For now, you can simply estimate these figures. You can always come back to this post once you’ve gotten the exact figures from your POS or accounting software.
How to Calculate Break-Even Point
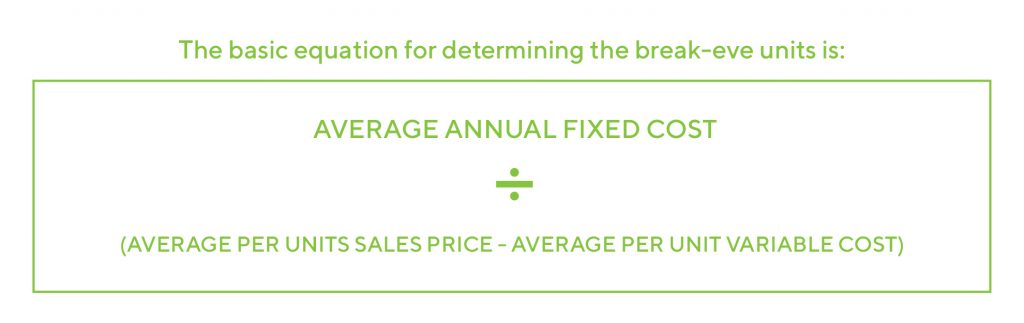
So let’s get down to brass tacks. Here’s the formula:
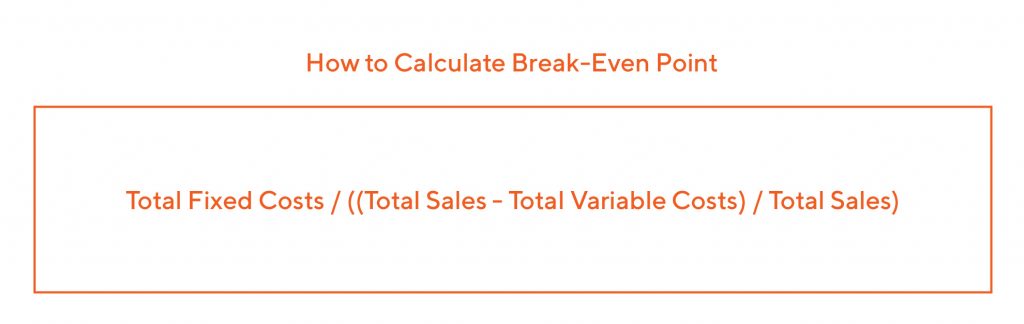
Written out, that’s total fixed costs, divided by total sales minus total variable costs divided by total sales.
Sounds complex, but it really isn’t too math heavy. Let’s look at a simple example.
Let’s say you’re a mom and pop restaurant, and you did $11,500 one month. That’s your total sales for the period.
Let’s say you had $4,000 in variable costs and $5,000 in fixed costs.
The first step is to solve the (Total Sales – Total Variable Costs) portion of the equation. That gives us $7,500.
Then, divide $7,500 by total sales.
That gives us .65.
The final step is to divide .65 by $5,000, which is your total fixed cost.
That gives us $7,692.
This means that you didn’t start earning profit until you sold $7,692 worth of meals.
So let’s break that down once more, step by step:
- Determine your total fixed costs and your total variable costs. Remember to include mixed costs with fixed costs.
- Determine your total sales.
- Solve (Total Sales – Total Variable Costs)
- Divide the result of (Total Sales – Total Variable Costs) by your total sales for the period
- Divide this figure by total fixed costs to arrive at your break-even point.
That’s pretty much it. Not too bad, right?
Here’s a general rule of thumb: if your actual sales are greater than your break-even sales, you can focus on lowering costs. If this is not the case, you should focus on increasing sales.
Creating Estimates
You may find it helpful to be able to use this simple formula on the fly. Say, if you find yourself in an impromptu meeting with a potential investor and you want to scribble out a few calculations on the back of a napkin. Most restaurant owners find they can easily estimate their fixed costs to within a few hundred dollars. So here’s a neat trick you can use to easily estimate those pesky variable costs.
All you need to know is what your total revenue was for a given period.
Then, the formula is:
Total Sales x .65
So, if you earned $11,500, you would multiply that by .65 to arrive at an estimate of $7,475 for variable costs. In the above example, the actual variable cost was quite a bit lower than this, but that may have been a particularly low cost month. This estimate may be more in line with average costs.
The logic is simply that in most restaurants, variable costs, or prime costs, will be around 65% of sales. This may be a bit high these days for a profitable restaurant, but if you’re doing a rough estimate, it’s more than adequate.
Now let’s look at one way you can influence the break-even formula in your favor.
Contribution Margin
Now that you know how to determine general break-even point based on overall sales, you may find it handy to know how to determine the contribution margin of individual menu items.
The contribution margin of a specific menu item is the price of that item minus its cost to produce.
It looks like this:
Item Price – Cost to Produce
Cost to produce is your estimate of the total cost of a single unit, factoring in fixed and variable costs. Of course, it’s better to have this nailed down to an exact figure if you can.
So, let’s say you sell an appetizer for $10. The total cost of the appetizer is $4.
Your CM, then, for that item, is $6.
Is this good or bad?
Well, you won’t be able to gauge that until you know your ACM, or your Average Contribution Margin. You get this by determining the CM of all items and then averaging that figure.
So to get ACM, you would conduct this simple calculation:
Sum of all CMs / total number of menu items
A modern POS coupled with accounting software can help you determine this quickly, but even if you have to do it manually on a per item basis, it can be well worth the effort.
You want the CM of an individual item to be at or above the ACM.
If the CM is below the ACM, then that item is likely not profitable. Of course, when analyzing individual menu items, you should keep context in mind. An entree will often have a higher CM than a dessert or appetizer.
In general, however, eliminating or tweaking items that fall below the ACM is one way you can maximize revenue, and thus manipulate the break-even formula in your favor. By removing items that fall far below the ACM, you can lower your costs and make space for better selling items.
Optimizations
Now that you know how to calculate break-even point for a given period, and how to determine contribution margin for individual menu items, let’s discuss a few ways you can optimize your break-even analysis going forward.
The Power of Moving Averages
It’s all well and good to determine your break-even point once or twice. That can help you get a feel for the number of tables you need to clear on a day or the number of dishes you need to serve. But where the rubber really meets the road is tracking your break-even point over time.
Think back to the formula above.
The variables within that formula change with time. By tracking your break-even point, then, you can get a general feel for how your operation is performing. The best way to do this is with a moving average, also known as a rolling average.
A moving average expresses how an average changes over time in visual form. Of course, to generate a moving average, you’ll need several periods of data to work with. For instance, if you have 12 months of data, you can determine your average break-even point by adding the value from each month and then dividing by 12.
This would be the first point in your moving average.
Then, at the close of month 13, you could plot a new point. To do this, you would simply discard the oldest data point—month 1—and replace it with month 13’s data, giving you a new 12 period moving average. In this way, you can easily see how your average break-even point changes over time.
If this sounds a bit abstract, don’t worry. Any modern accounting software will do this for you. You can even calculate moving average in Excel or Google Sheets.
If you take this one step further, you can create a real power tool.
You can create two moving averages with your data, one shorter than the other, and superimpose them on top of each other. This is known as a moving average cross.
Let’s say your ‘long’ moving average is the average from the example above. It’s a 12 period moving average, where each period is one month. Well, let’s say you create a moving average using 3 months as its period. When you plot this average, you will see that it moves much quicker than the 12 period moving average.
Superimposing them, you would see that there are times when the fast—3 period—moving average moves up through the slow—12 period—moving average, and vice versa.
This is known as a lagging indicator. It can’t predict the future, but it can give you early warning that something might be amiss.
If your shorter moving average moves up through your longer moving average, your break-even point is ticking up, and you should take corrective measures.
If, after taking these corrective measures, your faster moving average moves down through your slower moving average, you may have righted the ship.
Don’t let the math intimidate you. Modern tools coupled with a robust POS can automate this process for you. To get a feel for what moving averages look like, click here.
Here’s the bottom line:
An increasing break-even point month over month is a red flag for any restaurant.
You can also use these nifty charts to determine whether you can justify potential investments. Let’s say you’re offered an endorsement opportunity by a local, minor celebrity. They want $25,000 for the whole deal, which includes several meet n’ greets at your establishment and a few radio spots. Well, if you see that both your 12 period and 3 period moving averages are moving up, then it really isn’t a good time to spend that money. This would be an unwise investment. You should keep your powder dry.
Note that you can also use moving averages to track other important metrics like prime cost.
What Causes Break-Even Point to Creep Up?
There are several factors that can make your break-even point creep up over time. Below are the main causes you’ll need to keep an eye on:
- Your fixed expenses have increased. This may be rent, insurance, etc.
- Reduction in contribution margin. This can be caused by lower prices. It can also be caused by an increase in variable expenses without a corresponding increase in sales. If ACM falls, you will need more and more sales to cover fixed expenses.
- Unfavorable sales mix. If you have several low CM items on your menu, that will drag your ACM down. In the writing world, there’s a saying that goes something like this: kill your darlings. It refers to a writer’s tendency to keep a scene in a novel just because they like it, even if it doesn’t contribute much to the overall story. This can apply to you as well. If a menu item is far below the ACM, you must think carefully about keeping it on the menu. The ingredients for preparing it take up space, and energy is required to keep those ingredients refrigerated.
For more information on sales mix, we suggest checking out the paper, Menu Development and Analysis in UK Restaurant Chains. The analysis was done on UK restaurants, but it offers actionable insights for any restaurant.
Soaring into Profit
It’s time to learn how to manipulate one of the main variables in the break-even equation. That variable is cost.
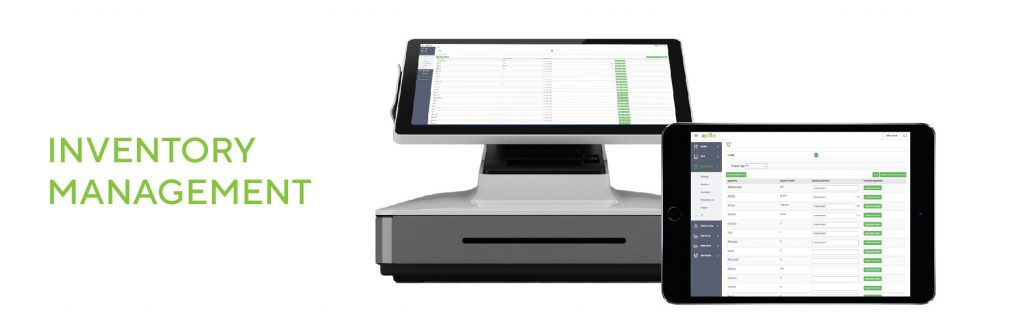
Inventory Management
A modern POS will give you several advantages. You’ll gain access to robust tools such as data forecasting, integrated accounting, automated inventory tracking and other reports.
Of course, your POS won’t account for spoilage, spillage, incorrect food prep processes or other inventory loss unless you can enter that data manually. For this reason, it’s a good idea to delegate inventory management to a management-level staff member. Ideally, you want no more than three people doing your inventory management. A good setup is one or two managers and the chef. This way, you’ll enjoy much higher consistency in your inventory management, which will lead to lower costs.
What’s more, the fewer people involved in counting inventory, the easier it will be for you to identify irregularities or inconsistencies. Finally, because inventory management makes up a large part of these employee’s daily responsibilities, they’ll be better acquainted with the nuances of your particular inventory.
Consider offering these employees bonuses based on inventory savings.
FIFO—first in, last out, isn’t the only tried and true inventory management technique. It’s also a great idea to follow a consistent schedule. By setting a specific schedule and sticking to it, you can get a feel for your ingredient use in a specific time period. Many established restaurants, for instance, check perishables every day, but only count bulk and dry once or twice a week.
However you decide to do it, it’s the consistency that counts.
If you don’t yet have a food waste sheet, you’ll want to create one ASAP, especially given that the average restaurant wastes 75,000 pounds of food each year. A food waste sheet allows your employees to record food waste on a per incident basis. Over time, this can give you insights into how to prevent food waste, and thus save money.
For instance, when most owners implement a food waste sheet, one of the first things they see is how often wait staff enter orders wrong in the POS. Not only does this waste food—and money—it also generates frustration in the kitchen.
You can create a master template easily enough. Then just print it off as needed. At minimum, your food waste sheet should include:
- Time and date
- The item in question
- The amount, such as weight in grams or ounces
- The reason why it was wasted
- The employee’s initials
Of course, not every employee will use the food waste sheet when they’re supposed to, but something is certainly better than nothing. Let them know that the point of the sheet is to help you save money, which may translate into higher wages for them down the road.
Growing Revenue
We’ve looked at the cost variable, now let’s see what we can do about total sales. In today’s market, getting noticed by consumers means standing out. It means doing what your competitors aren’t willing to do. And a big part of that is making sure your website and social media profiles are up to snuff.
More and more, people are accessing the Web via their mobile phones. No matter how much work you put into your website, if it’s not optimized for mobile, mobile users will be put off by it. Invest in a website that looks great on:
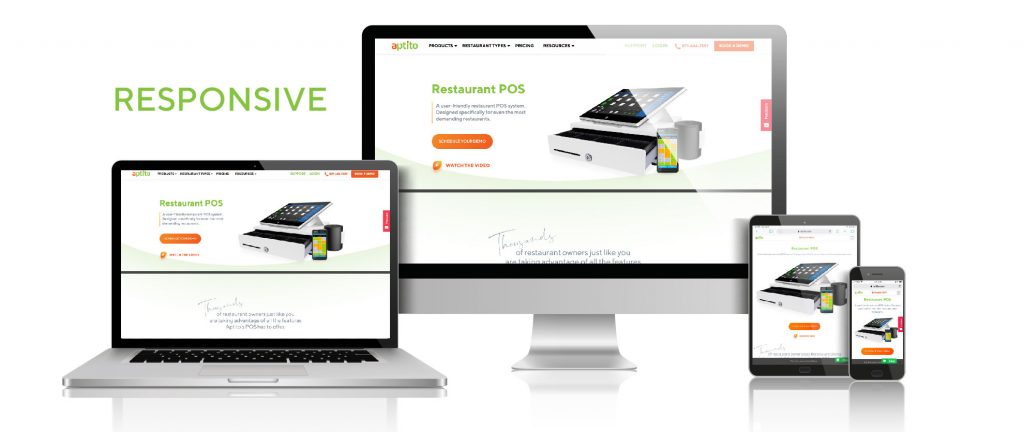
- Desktop
- Phones
- Tablets
This is known as responsive design, and it’s essential in 2019 and beyond.
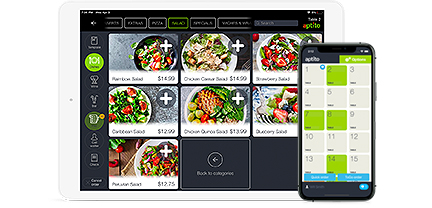
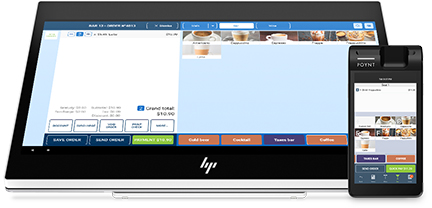
Along the same lines, use a modern POS that allows your wait staff to take orders on inexpensive smartphones and tablets. These devices allow your wait staff to show customers vivid images of entrees, appetizers and desserts. Not only will this give your restaurant a modern touch, it will make your wait staff more efficient, allowing them to earn higher tips.
Similarly, consider adding a self-order kiosk to your establishment. This allows tech-savvy customers to help themselves, and like the above tip, it also allows your wait staff to be more efficient.
If you haven’t already, it’s a good idea to claim your business on Google My Business and other business listing sites. But Google My Business is by far the most important, and you should prioritize it. When you sign up, you’ll have an opportunity to check your information, such as address, phone number and web address to make sure it’s completely accurate.
Once you’ve claimed or created your GMB listing, you can post images of your dishes onto the page. Customers will even be able to add their own photos.
If you haven’t created social media accounts for your restaurant, it’s time to do so. Facebook remains popular, but Instagram is a stellar platform for restaurants as it has a more visual focus. Post alluring images of your best-selling dishes and watch as the comments stack up. You can do the same thing on Pinterest, by the way.
Creating social media accounts and posting to them frequently is a great way to humanize your brand. These days, consumers prefer to patronize companies that show a more human side. By posting photos of your staff at work and play on Instagram, Pinterest and Facebook, you can show customers that your establishment has soul. You’re not just a faceless business out to get their money.
To get a better idea of how posting to sites like Instagram can help your business, see the case study, Instagram and Branding: A Case Study of Dunkin’ Donuts.
In particular, make sure you’re active on social media in the months and weeks leading up to your city restaurant week. Americans now spend more money on dining out than they do on groceries, and local restaurant weeks can be a great driver of business.
Social media—and for that matter, content marketing—need cost you nothing but your time. Granted, many restaurant owners are very busy, but if you can squeeze out some time for this, you can see concrete returns. There are tools like Hootsuite and Buffer that make it easier to post to social media consistently.
We hope you’ve found this guide to break-even point analysis helpful. If you know someone who might benefit from this post, please don’t hesitate to share!